While the use of refractometers has become relatively common today, I recall that prior to the 2010s, it was exceedingly rare for baristas or brew personnel to objectively analyze extraction using concentration measurements. Refractometers certainly existed, and the concept of extraction yield (EY) was known, but on-the-ground usage—such as monitoring or calibrating extraction using values like TDS or EY—was almost nonexistent in café settings.
The shift seems to have been sparked by the introduction of the Golden Cup Standard and the Brewing Control Chart released by the SCAA. These initiatives promoted the practice of measuring TDS with a refractometer, calculating EY from the brew ratio and TDS, and then using these values to evaluate extraction.
Extraction Yield (EY) represents the proportion of soluble coffee compounds that have moved into the brewed liquid. When combined with sensory evaluation, EY values help us determine whether an extraction is under- or over-extracted, thereby enhancing reproducibility and consistency in brewing.
As a coffee educator, I often receive questions about TDS and EY. Even today, there still seems to be some confusion among coffee professionals, and not many can clearly articulate the difference between the two.
Evaluation of brewed coffee should involve TDS, EY, and—most importantly—sensory evaluation. None of these should be considered in isolation. Let’s explore them in turn.
TDS (Total Dissolved Solids)
TDS is an indicator of how much material (solute) has dissolved in a liquid (solvent). It is usually expressed in units such as %, ppm (parts per million), or mg/L. It refers to the solids remaining after a solution is evaporated, and is sometimes called “evaporative residue.”
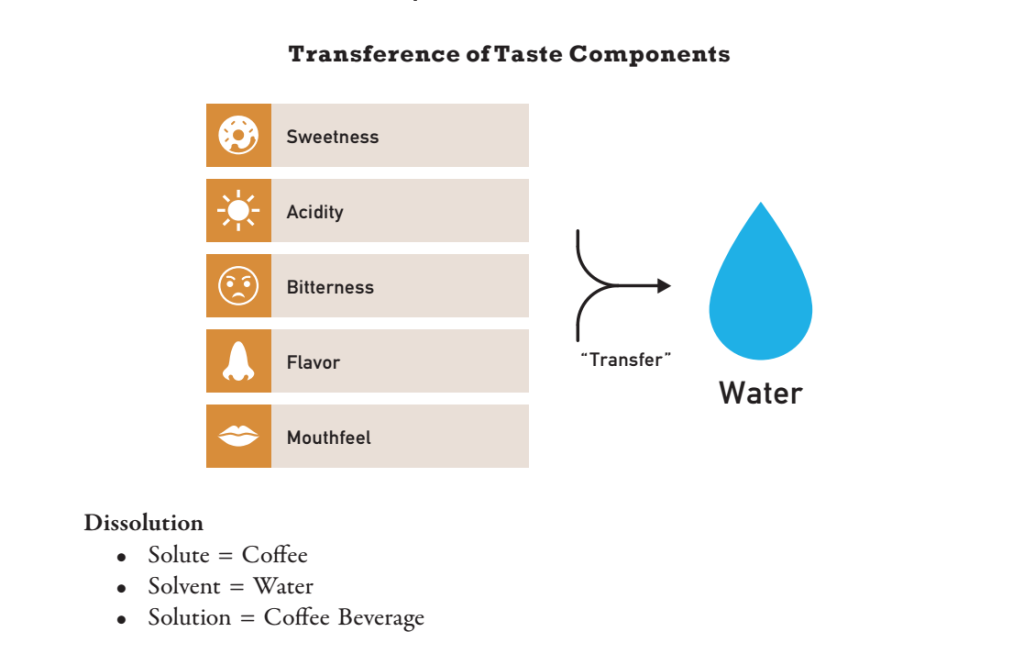
When a substance is added to a liquid, it can take one of three states depending on its physical properties:
1. Suspension (colloidal dispersion)
2. Dissolution
3. Ionization
Suspension occurs when particles remain in the liquid as fine solids (colloids), but eventually settle over time. For example, when potato starch is mixed with water, it will gradually settle at the bottom, leaving a clear liquid on top. Suspensions do not form stable solutions and are generally opaque.
Dissolution refers to a state where a substance is attracted to the polar charges of water molecules (positive hydrogen, negative oxygen), causing its molecules to disperse throughout the liquid. The molecules are not broken down but remain intact and suspended individually, resulting in a transparent solution.
Ionization happens when a substance dissociates into charged ions. For example, when sodium chloride (NaCl) dissolves in water (H₂O), sodium ions (Na⁺) are drawn to oxygen atoms while chloride ions (Cl⁻) are drawn to hydrogen atoms. This also forms a clear solution.
TDS is commonly measured in ppm. In liquids, 1 ppm means one part per million of solute in a liter (or kilogram) of solution.
– 1 ppm = 1 µg/g = 1 µg/mL
– 1 ppm = 1 mg/L
– 1 ppm = 0.0001%
For example, if 16,000 µg of coffee solids are dissolved in water, the TDS would be 16,000 ppm, or 1.6% when converted to percent.
*TDS 1% = 10,000 ppm
A high TDS value simply means a higher concentration of dissolved substances, indicating a “stronger” liquid.
Since TDS values are typically used in EY calculations, TDS in the coffee industry is generally expressed as a percentage.
Refractometers for measuring TDS include ATAGO’s PAL-Coffee and VST’s coffee-specific model, among others. For high-precision work, VST’s device is considered the most reliable.
ATAGO: http://www.atago.net/product/?l=ja&k=CCF59218
VST: https://store.vstapps.com/
EY (Extraction Yield)
Extraction yield (EY) expresses how much of the coffee solids have moved into the brewed liquid. It indicates the degree to which the coffee has been extracted—whether under- or over-extracted.
The formula for EY is as follows:
EY (%) = Brewed Coffee Mass (g) × TDS (%) ÷ Ground Coffee Mass (g)
You must measure TDS in advance using a refractometer. Also, the ratio of water to coffee grounds is known as the “brew ratio,” calculated as:
Brew Ratio = Water Mass (g) ÷ Coffee Grounds Mass (g)
Example:
– 10g of coffee brewed with 140g of water (brew ratio = 14)
– Final brewed mass = 121g, TDS = 1.6%
Using the above formula: EY = 121 × 1.6 ÷ 10 = 19.36%
A higher EY means more coffee material has been transferred into the brewed liquid. However, whether this indicates over- or under-extraction depends on sensory evaluation—it cannot be judged on EY alone.
In everyday operations, if the same coffee tastes different from usual, comparing EY values may suggest changes in grind size, water temperature, or technique. Monitoring TDS and EY supports consistency in coffee flavor.
Despite the usefulness of TDS and EY, many people still confuse the two. As discussed earlier, they are distinct concepts, and high TDS does not necessarily mean high EY. For example, a diluted brew via bypassing may lower TDS without changing EY.
Four basic combinations (Brewing Vector)
– Low TDS & Low EY: Thin body, simple flavor, acidity stands out
– Low TDS & High EY: Thin body, complex flavor, sweetness/bitterness enhanced
– High TDS & Low EY: Strong body, simple flavor, acidity stands out
– High TDS & High EY: Strong body, complex flavor, sweetness/bitterness enhanced
Note: TDS measures total dissolved solids (suspended, dissolved, and ionized). Optical TDS meters measure refractive index but do not reveal the composition of those solids.
Even if two brews have identical TDS and EY values, their flavor profiles may differ due to different chemical compositions. Thus, comparisons should be made within the same brew category (e.g., espresso vs. espresso, pour-over vs. pour-over).
For instance, French press includes more suspended solids than pour-over, so they are not directly comparable.
Golden Cup Standard
Earlier, we noted that EY values alone cannot determine extraction quality. However, some guidelines have been proposed. The SCAA’s Golden Cup Standard aimed to set such parameters, including brew ratio, TDS, grind size, temperature, and EY.
Originally based on research led by MIT’s Prof. E.E. Lockhart in the 1950s and later refined by SCAA, the consensus EY range was established at 18–22%.
Golden Cup EY Recommendations
– Below 18% = Under-Extracted: Incomplete extraction of desired compounds
– Above 22% = Over-Extracted: Excessive extraction, leading to increased bitterness
Coffee extraction is sequential: acids extract first, followed by sugars, and finally bitter compounds. Thus, under-extracted brews may be acidic and light-bodied, while over-extracted brews may be bitter and heavy.
The SCA has published a Brewing Control Chart to illustrate the relationship between TDS and EY:

Classic Brewing Chart: https://sca.coffee/sca-news/25/issue-13/towards-a-new-brewing-chart
More recent models use a three-axis matrix to accommodate diverse brewing methods.
The original recommended ranges are now often exceeded, especially with modern brewing styles. Therefore, each café or brewer should define their own acceptable TDS/EY targets.
At Roast Design Coffee, our pour-over coffee typically has a TDS just under 1.2% and an EY around 14%. While this may fall into the “Under” zone on the chart, our customers and industry professionals rarely describe it as “weak” or “under-extracted.” Many instead comment on its “clarity and depth.”
In the end, a balanced use of objective metrics and subjective sensory analysis remains the ideal approach. If the flavor is satisfying, the numbers should not be the sole criteria for judgment.